Zomato_Analytics
This project involves analyzing restaurant data using Power BI for visualization and MySQL for managing employee-related data. The focus was on deriving actionable insights through data modeling, querying, and interactive dashboard creation.
Key Tasks
- Restaurant Data Analysis
- Built a relational data model using restaurant datasets.
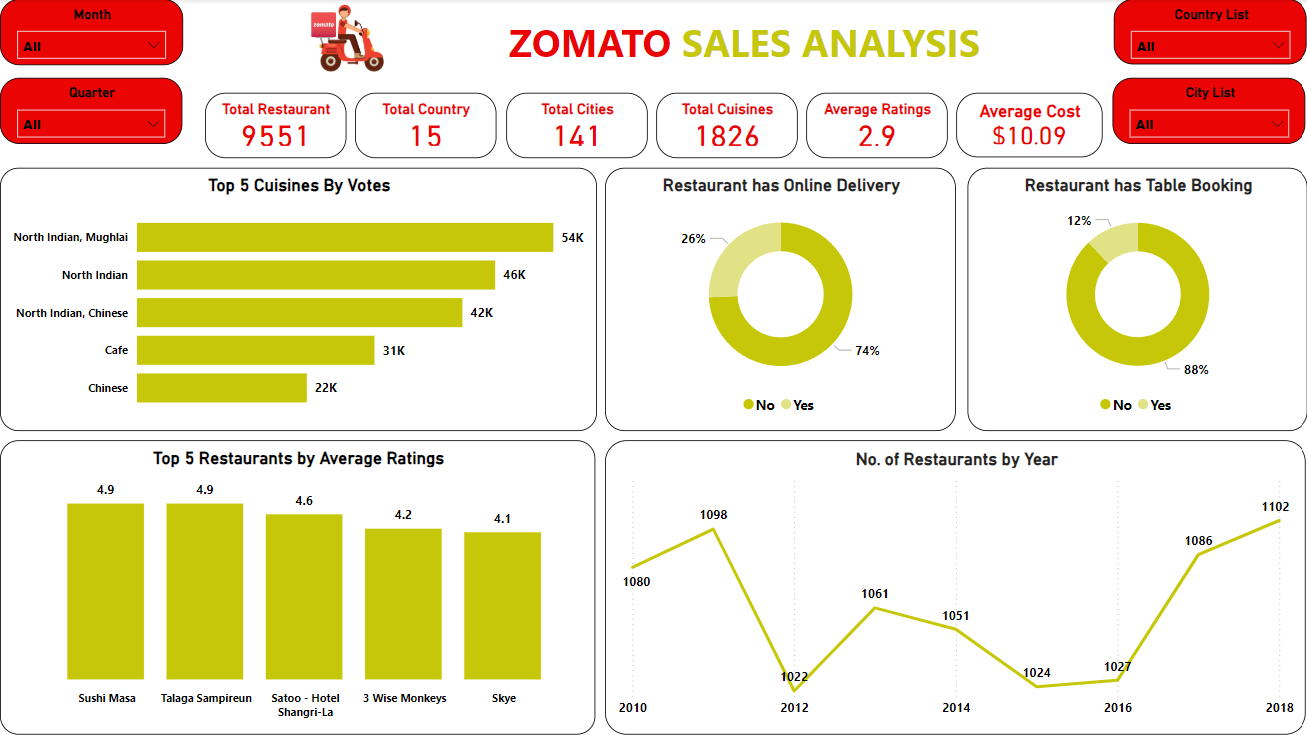
- Designed interactive Power BI dashboards to visualize metrics, including:
- Restaurant openings by year, quarter, and month.
- City-wise and country-wise restaurant distribution.
- Percentage of restaurants offering table bookings and online delivery.
- Restaurant segmentation based on cost and ratings.
- Employee Data Analysis
- Designed and optimized MySQL databases for employee-related datasets.
- Developed SQL queries to generate insights, such as:
- Salary analysis and comparisons across departments.
- Employee rankings based on performance metrics.
- Department-wise performance summaries.
Tools & Technologies
- Power BI: For building dashboards and visualizing restaurant data.
- MySQL: For querying and analyzing employee data.
Key Insights
- Restaurant trends: openings by time period, distribution by location, and service types offered.
- Employee insights: salary distribution, performance comparisons, and department-level summaries.
Dashboard created for analysis
Using Power BI: